The numbers that matter, and how we get them.
Benchmarks from live networks, and the method behind every one of them. Each number below has a one-line definition further down the page.
Written for the skeptic.
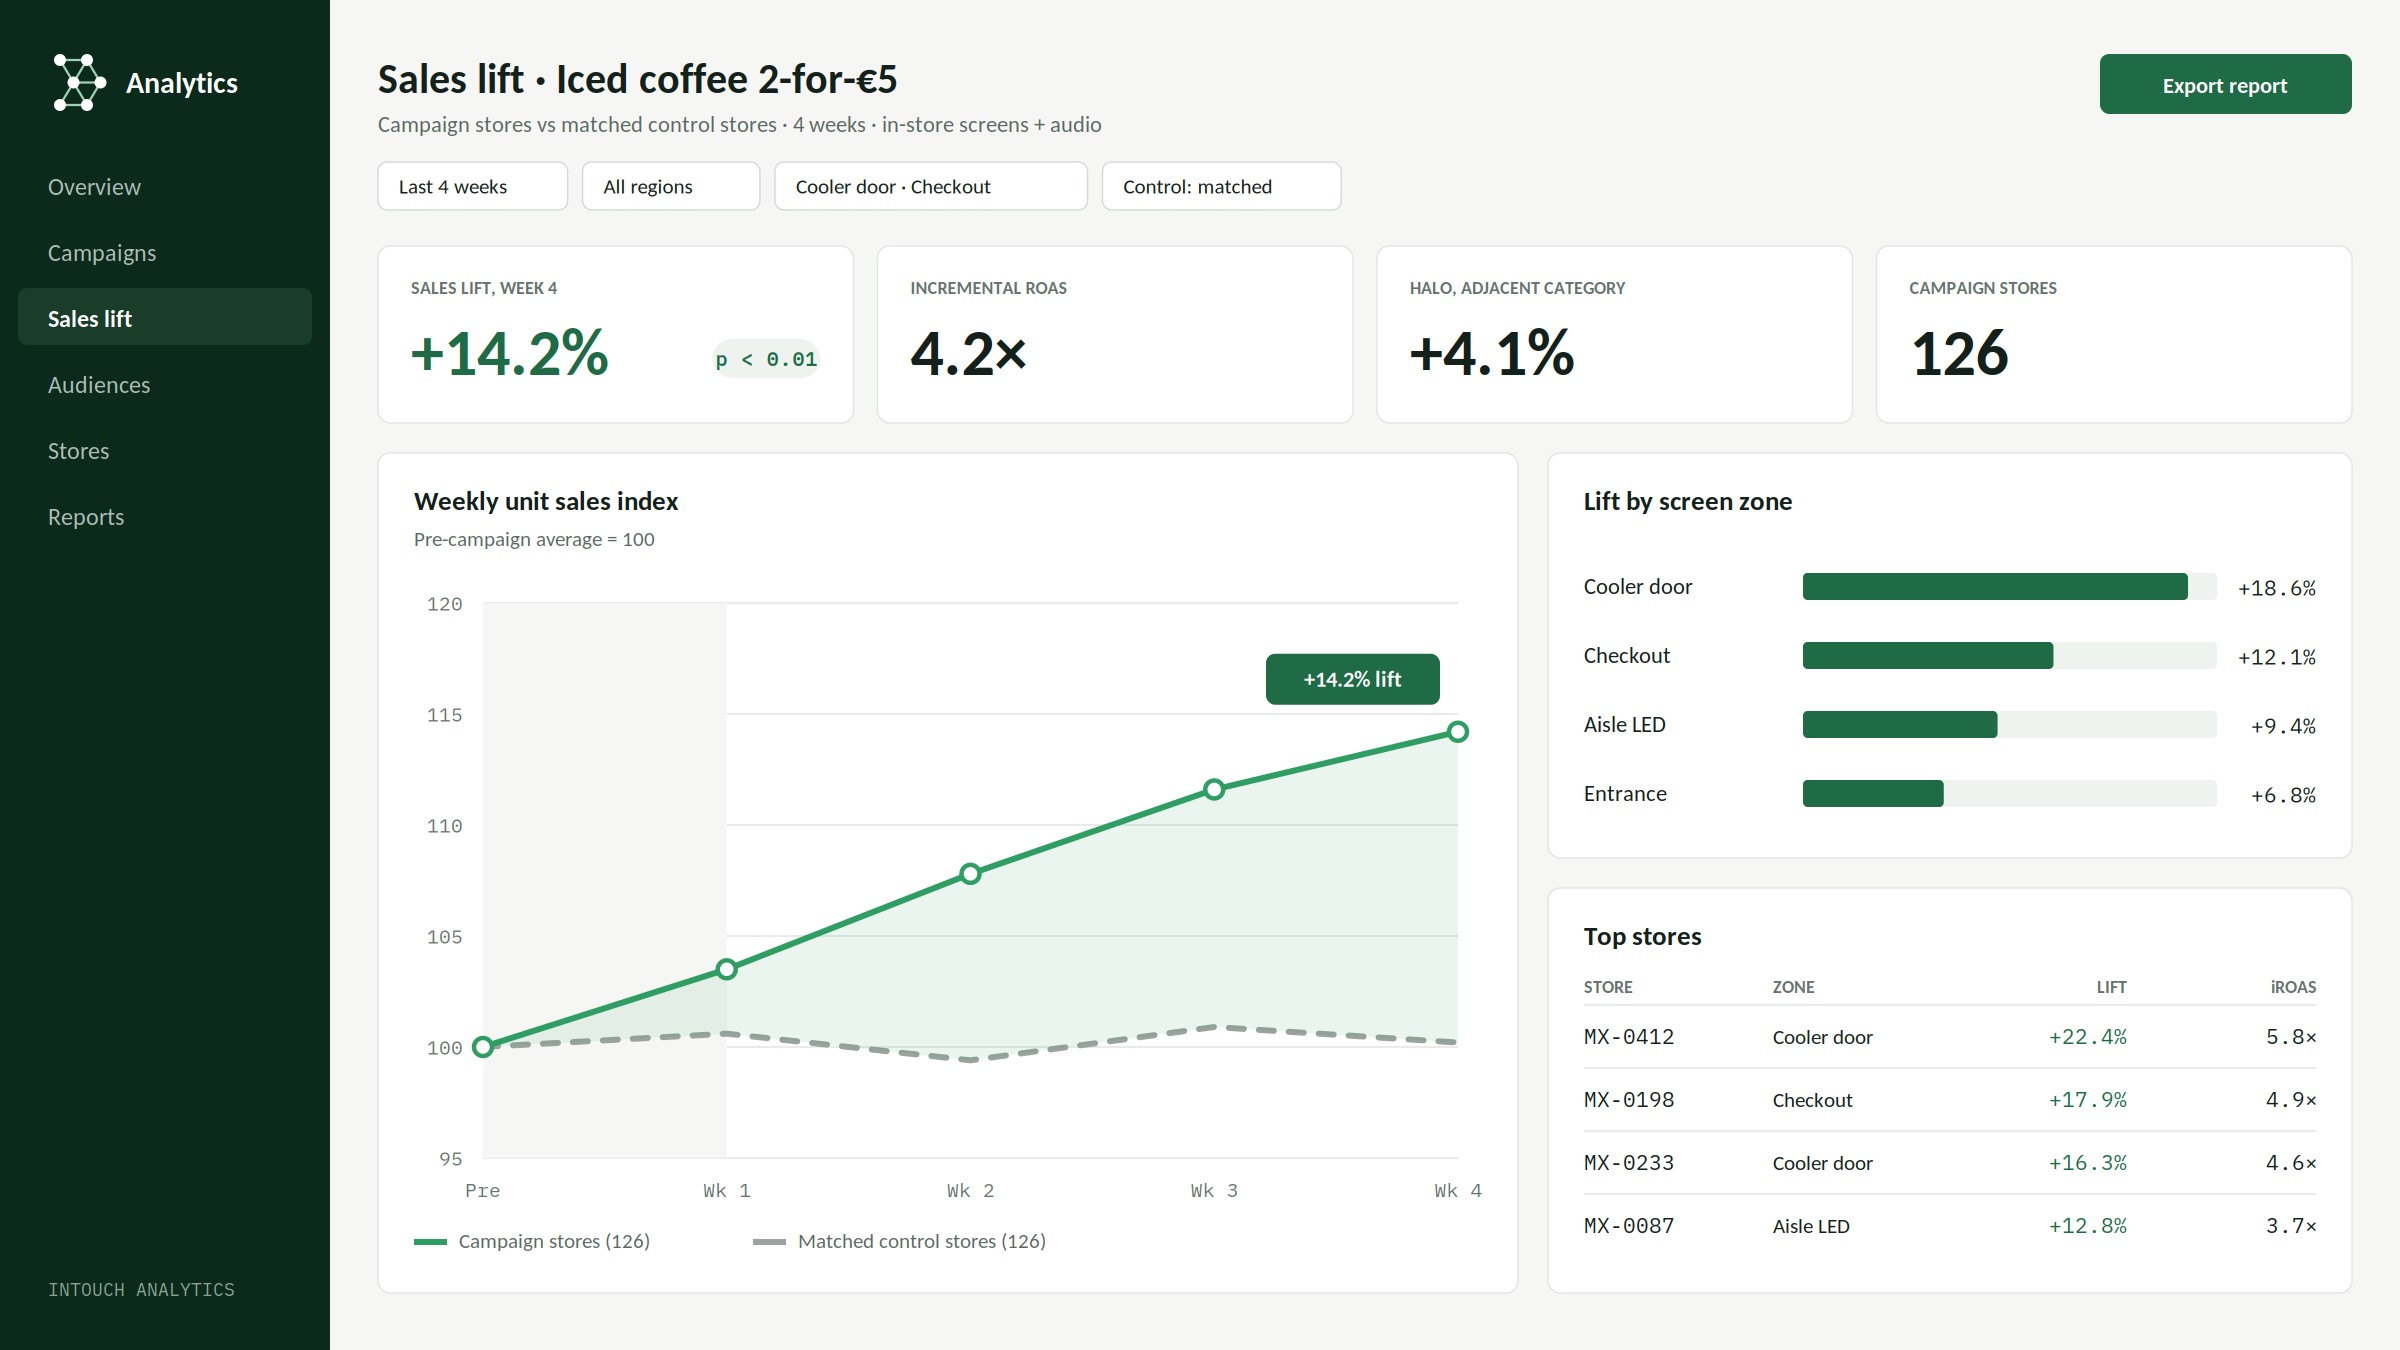
Sales lift is measured, not modeled. Four steps, the same for every campaign and every channel.
- {{m.n}} {{m.t}}{{m.d}}
If your analytics team wants to check our math, we will enjoy the meeting.
An impression counts toward a sale only when the same store records a matching transaction inside the window, typically 30 minutes. Transactions are anonymized and aggregated before matching.
of advertisers fully trust retail media self-reporting. We built for the other 97%.
Control stores, raw exports and IAB-aligned definitions. Nothing your analytics team has to take on faith.
Bring your analytics teamHow each number is defined.
One line per benchmark. If a number is on this site, it is defined here, and we can show the working on a call.
Bring your analytics team.
We walk them through the control-store design, the attribution window and the raw exports. Hard questions welcome.
Book a methodology call